The Riddler is a weekly puzzle series from Oliver Roeder at FiveThirtyEight that usually involves some combination of math, logic and probability.
This weeks FiveThirtyEight Riddler, Can You Solve This Elevator Puzzle was:
In a building’s lobby, some number (N) of people get on an elevator that goes to some number (M) of floors. There may be more people than floors, or more floors than people. Each person is equally likely to choose any floor, independently of one another. When a floor button is pushed, it will light up.
What is the expected number of lit buttons when the elevator begins its ascent?
Similar to last week, I wanted to simulate the problem before jumping into the math. This’ll also help later to check my work.
While certainly not elegant, all I did here was create 10 arrays of 0’s of size 5 to 50 by 5. Array size represents total number of floors (M in context of the problem). From there, I randomly generated an integer from 1 to M, and changed the number at that array index to 1 — representing a pushed button. Repeated the random number generation N times to represent different passenger sizes (all the way until N = M). Finally I re-did this for each array 100 times at a given M/N and then averaged the array sum (representing buttons pushed. Again, not elegant, but it gave me a quick representation of what the data should look like.

We’ll be using fN to represent expected value of pressed elevator buttons throughout this post.
Initially let’s deal with a situation where M (floors) = 5. The expected pressed buttons for the first passenger (f1) is fairly straightforward:
f1 = 1
Since the next passenger is equally likely to select any of the 5 buttons, the elevator configurations after he presses a button are:
| O | O | X | X | O |
Where he selects a different button from passenger 1 or
| O | O | X | O | O |
selects the same button as passenger 1. Given that he has a 1/5 chance of selecting the same button as passenger 1, we compute f2 to be:
f2 = 1 [number of buttons already pushed] + (1)*((M‑1)/M) [probability of selecting unique button]
@ M=5 this evaluates to:
f2 = 1 + (4/5)/5 = 9/5 = 1.8
The f2 equation can be more generally written as:
f2 = f1 + (M‑f1)/M
or
fN = fN‑1 + (M‑fN‑1)/M
Now that we have an equation, let’s test it against some of the data we generated earlier.

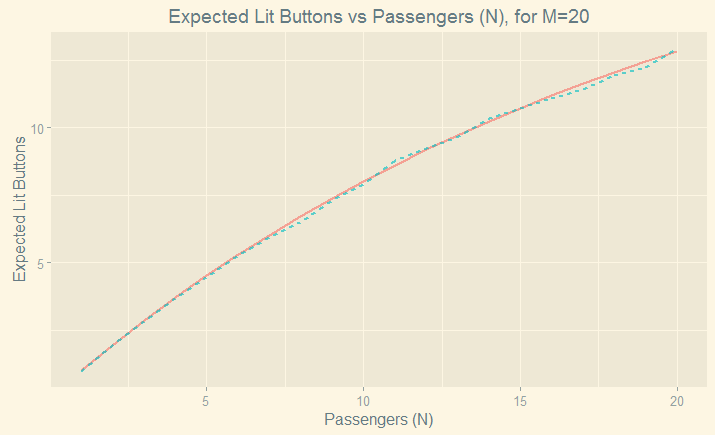
So our equation (dashed blue line) fits the simulated data (coral solid line) fairly well. Now we can start trying to simplify our equation. Let’s start by evaluating fN in N = 1:4.
Let c = (M‑1)/M.
f1= 1
f2 = 1+fN-1*c = 1 + f1*c = 1 + c
f3 = 1 + fN-1*c = 1 + f2*c = 1 + (1+c)*c = 1 + c + c2
f3 = 1 + fN-1*c = 1 + f3*c = 1 + (1 + c + c2)*c = 1 + c + c2 + c3
The trend is clear. It’s a geometric series that can be written as:
We go back and plug in c = (M‑1)/M and find the solution to fN
fN = ((M‑1/M)^N ‑1)/((M‑1)-1) =M — M*((M‑1)/M)^N
Since we’re concerned with the proportion of pushed buttons, and fN gives you the expected number of pushed buttons, simply divide out M and get the final solution
1 — ((M‑1)/M)
EDIT (05.13.2016): I misread the question, and we want expected number of buttons pushed, not expected proportion of buttons pushed. Therefore the final answer is:
M — M*((M‑1)/M)^N