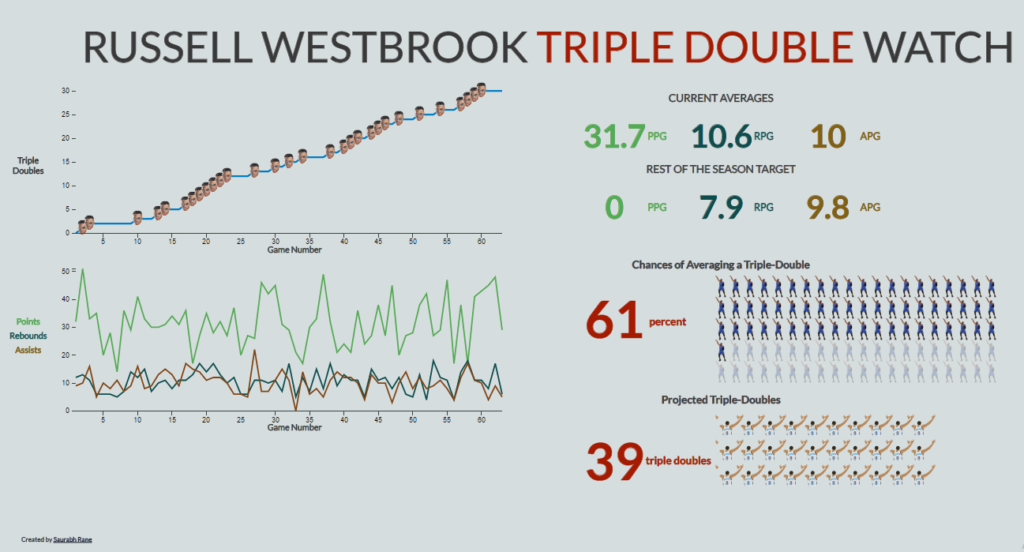
How can we design a dashboard to allow users to easily track Russell Westbrook’s stats?
R • d3 • Data Analysis • Data Visualization
Project Overview:
A triple double is when a basketball averages 10 points, rebounds, and assists. The only player to accomplish that over the course of an NBA season was Oscar Robertson, roughly 50 years ago. Russell Westbrook, currently a point guard for the Oklahoma City Thunder, has a been close to that milestone all season — a feat that has been talked about greatly in the media this year.
I wanted to create an interactive dashboard that would allow users to explore and analyze Westbrook’s historic season. This intially entailed using R to query data off NBA’s API and generate a probabilistic model for Westbrook’s chances of averaging a triple-double. From there I used Javacsript’s d3 library to deliver an information rich, interactive interface.
The project can be found here, and will continue to live update through the rest of the NBA season. A screenshot is below.

