I’m of the belief that a team cannot succeed with an entire system based on a ball dominant player. Moreover that those systems greatly inflate the stats, specifically assist numbers of the ball dominant player. Consequently, I’ve argued against players like Rondo, Rubio, and even Chris Paul. I think these players all have inflated assist and point totals because a large proportion of their team’s possessions either end with the player shooting or making a pass that leads directly to a shot.
Thanks to NBA’s great tracking stats, specifically their touches/possessions, it’s easy to see which players are holding the ball the longest. I’ll be tracking ball dominance with [front court] touch time per minute. The below chart shows the relationship between USG% and Touch Time/Min (measured in seconds) for point guards (min. 30 games, 28MPG). The dashed lines represent the averages of each value (for this and all other charts.
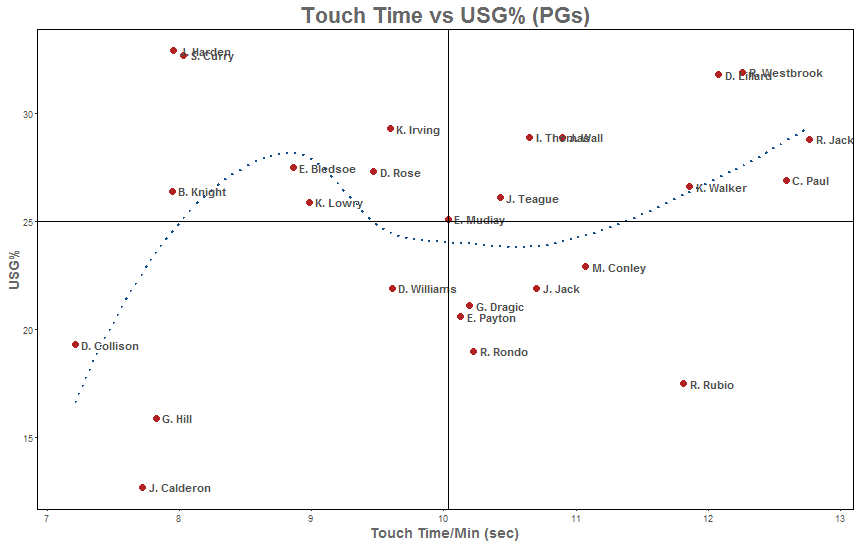
What really stood out here was the relationship (or lack thereof) between USG% and ball dominance. A possession is used by a player if they shoot a FG/FT or turn it over. Consequently players that initiate a lot of offense, but don’t shoot the ball (i.e. Rubio, Rondo) have a high touch time/min but low usage. That upper left quadrant, conversely, are point guards that take a large percentage of their team’s shots, but create those opportunities off the ball.
Moving on, the below chart illustrates the relationship between the percent of team assists that come from a given player as compared to touch time.
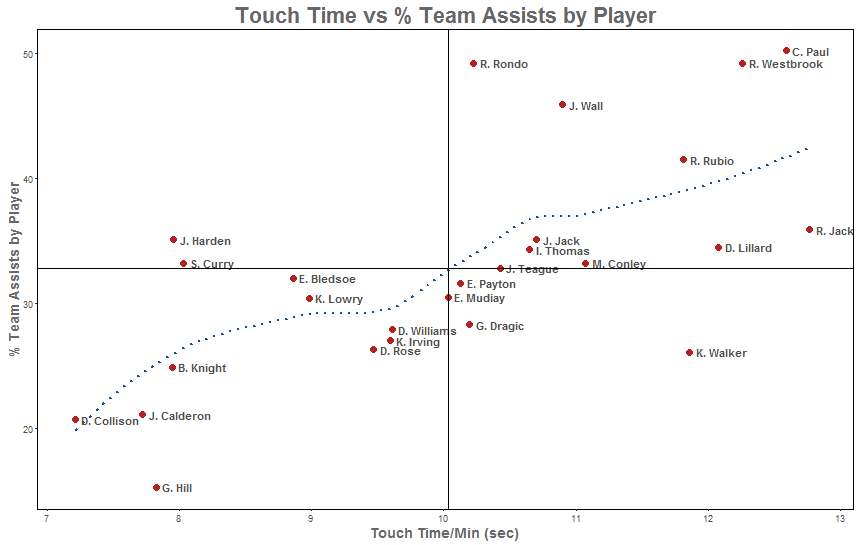
There seems to be a weak relationship here between touch time/min and a player’s assist percentage (adj. r‑squared = 0.4). This was more in line with expectations; players that have the ball in their hands the majority of the time likely pick up the majority of stats that require a player to handle the ball (points, assists). However, there does not seem to be a correlation between percent of assisted FGM as compared to FGM to percent of assists coming from a team’s point guard. The fact that these point guards dominate the ball does not seem to have a discernible effect on the ball movement of a team (as measured by percent of assisted FGM by a team).
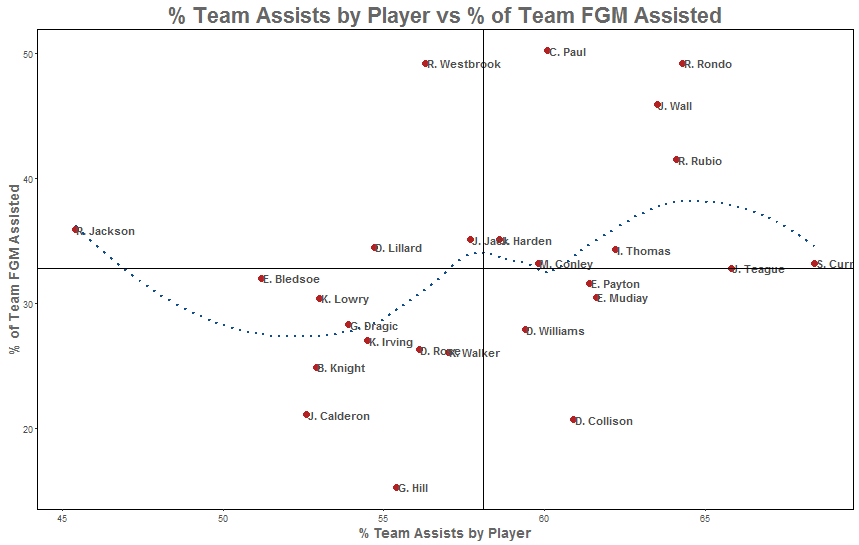
So far this hasn’t shown anything new. Players like Chris Paul are the engines of their offense – they hold the ball for the majority of their team’s possessions and any sort of ball movement (quantified by assists), directly involves that ball dominant player.
That led to the though that once these ball dominant players come off the floor, the offense should, correspondingly, fall apart. The chart below shows the relationship between a team’s on/off ORtg for a given player and how ball dominant that player is.
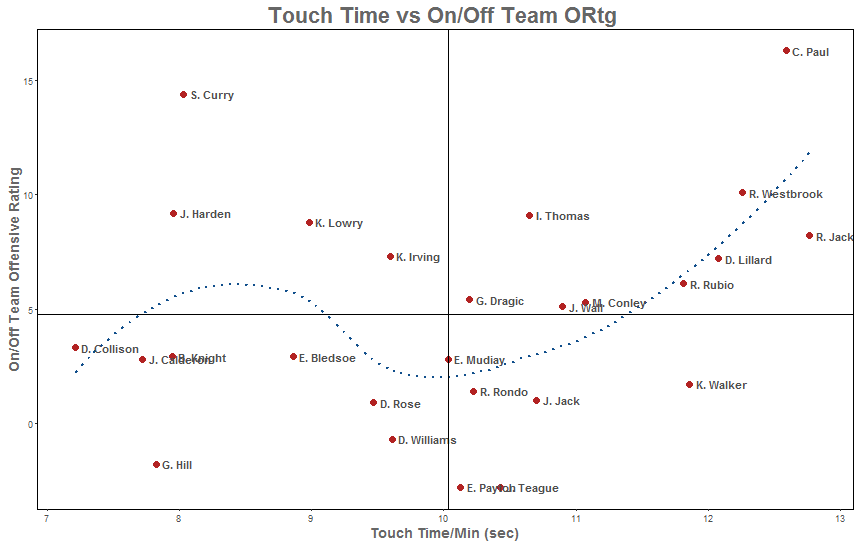
It’s important to preface that on/off has a lot of flaws. Someone like Rondo that is replaced by an above average backup like Collison, than Rubio who is replaced by LaVine. Again, there does not seem to be any correlation. A team’s offensive efficiency does not seem to be necessarily dictated by the presence of their ball-dominant players on the court.
A player’s on/off effect on ORtg does however seem to be correlated with USG% (see chart below, adj. r‑squared = 0.27).
Overall, I did not find any discernible trend between a team’s offensive performance and how ball dominant their point guard is. Consequently, I’m will to accept that that a ball dominant point guard is not as detrimental to a team’s offense as I originally thought. The data about USG% and on/off rating is particularity interesting (especially how it differs for point guards, wings, and bigs).
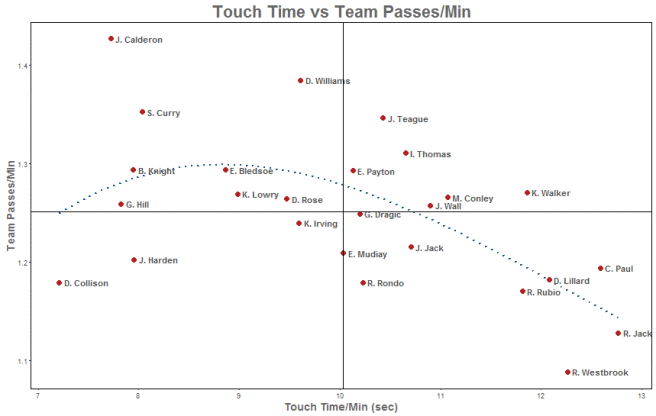
Other data points that do seem to have a relationship are passing rate (how often a team passes) and ball dominance (adj. r‑squared = 0.31). However, it’s also worth noting that pass rate seems to have no correlation to offensive rating .
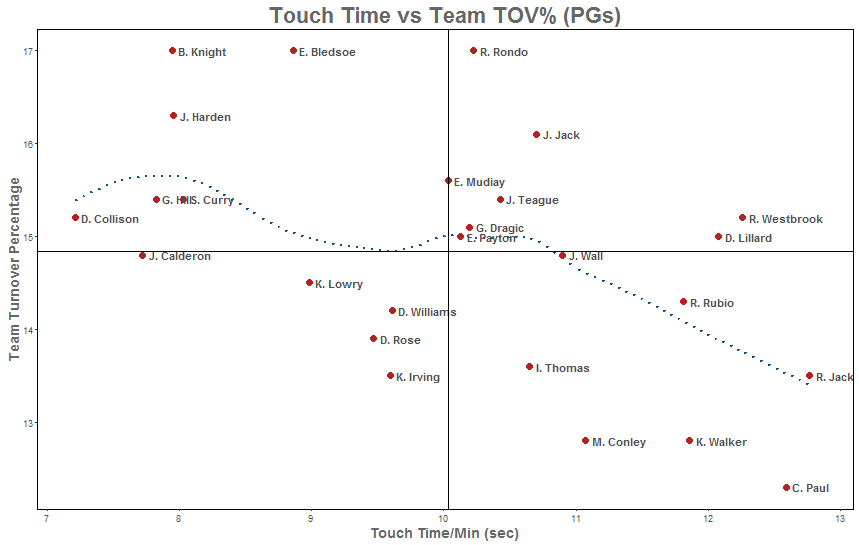
Touch time/min is also weakly negatively correlated with team turnover percentage (correlation coefficient (adj. r‑squared = 0.21. I’d attribute to this to the fact that teams that don’t have a ball dominant PG, are putting the ball in the hands of non-guards.
Method:
All stats from Stats.NBA and Basketball-Reference. Analysis was done via R, charting done through the ggplot2 package.


